Versatile building management system at COPA-DATA
Success Story
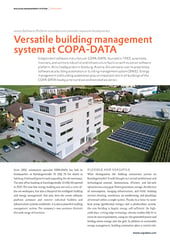
Independent software manufacturer COPA-DATA, founded in 1987, automates, monitors, and controls industrial and infrastructure facilities with its zenon software platform. At its headquarters in Salzburg, Austria, the company uses its proprietary software as a building automation or building management system (BMS): Energy management and building automation play an important role in all buildings of the COPA-DATA headquarters and are orchestrated via zenon.
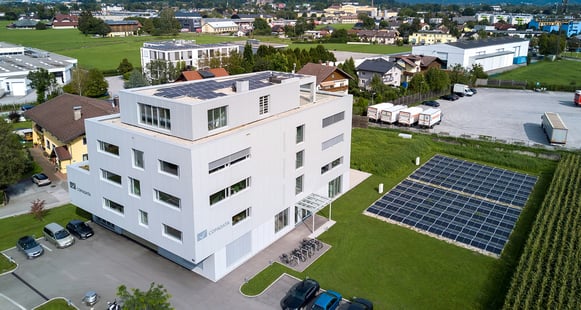
Since 2002, automation specialist COPA-DATA has had its headquarters at Karolingerstraße 7b (HQ 7b for short) in Salzburg. Continued growth made expanding the site necessary: The new office building at Karolingerstraße 33 (HQ 33) opened in 2022. The new low-energy building was not only a state-of-the-art workspace, but also a blueprint for intelligent building and energy management. Not only does the zenon software platform automate and monitor industrial facilities and infrastructure systems worldwide, it is also a powerful building management system. The company’s own premises illustrate this wide range of functions.
What distinguishes the building automation system on Karolingerstraße? A well-thought-out overall architectural and technological concept: Autonomous, efficient, and fail-safe operation was a key goal. Power generation, storage, distribution of consumption, charging infrastructure, and HVAC building services (heating, ventilation, air conditioning, and plumbing) all interact within a single system. Thanks to a brine-to-water heat pump (geothermal energy) and a photovoltaic system, the new building is largely energy self-sufficient. On high-yield days, cutting edge technology already enables HQ 33 to cover its own requirements, using on-site generated power and feeding excess energy into the grid. In addition to sustainable energy management, building automation plays a central role: heating, ventilation, lighting, shading, and air-conditioning. With zenon, this complex interplay can be monitored and automatically controlled – easily and conveniently.
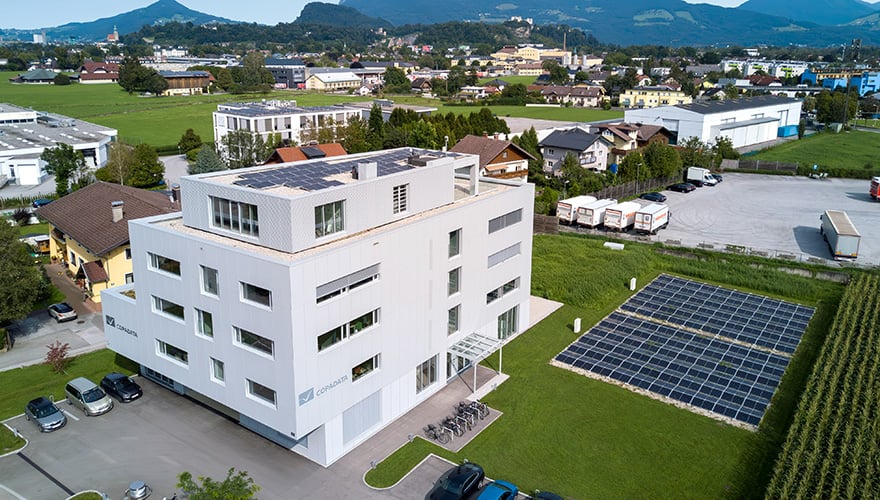
COPA-DATA Headquarters, Karolingerstraße 33, Salzburg, Austria. In the background is the building at Karolingerstraße 7b.
“Our HQ is a clear reference project that illustrates how zenon works and how versatile the software is,” says Marko Šulejić, Developer of Trainees at COPA-DATA. Apprentices in the Coding/Application Development trade are responsible for COPA-DATA’s building management system: “This gives our junior team the opportunity to gather valuable experience.” The zenon software platform is designed for adaptability, and this exact flexibility makes it possible to implement a wide variety of projects. The following aspects of the building management system at COPA-DATA headquarters are especially relevant:
The photovoltaic system, paired with an external supply of regional green electricity, provides primary power generation. zenon visualizes yield, feed-in, consumption, and control on two levels: 1. Technical handling: The software displays all system stages down to the actuators. 2. Everyday control: A user-oriented, browser-accessible interface enables daily operation.
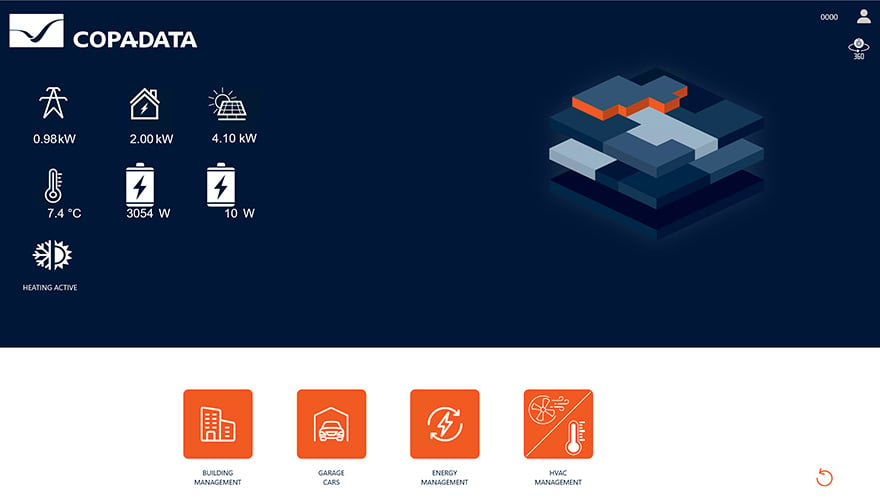 User-oriented software level: Start page of the browser-based user interface building visualization HQ 33
As a BMS, zenon consists of clearly defined modules. The overall system, comprising automation and energy management, is fully integrated, mapped, and controllable. This includes:
Device types include, for example, wallboxes, the heat pump, and KNX fieldbus actuators for building automation. Each type is integrated into the system using dedicated drivers to ensure tailored functionality and control. Standardized and hierarchically structured recording of measured and status variables is essential for sustainable, low-energy building control: mapping everything from meter values to building KPIs. This data forms the foundation for visualization and control, processed by control logic structured into zenon Logic modules after scaling and monitoring against configured alarm thresholds. Examples include the “chargepoint manager” and “component activation control.” Module communication occurs via a central variable model, ensuring adjustments can be made without altering the model structure.
All modules and acquired data are accessible on the primary visualization level for technical management. Visualization and control modules are implemented as parametric Smart Objects (SO), combining display features, local state logic, and standard alarms. Through parameterization, dedicated SO templates ensure consistent functionality across diverse hardware environments. Live values, trends, and event lists are presented through KPI dashboards. Standardized diagnostic routines can be defined for routine issues, such as resolving incorrect meter readings or resetting meters.
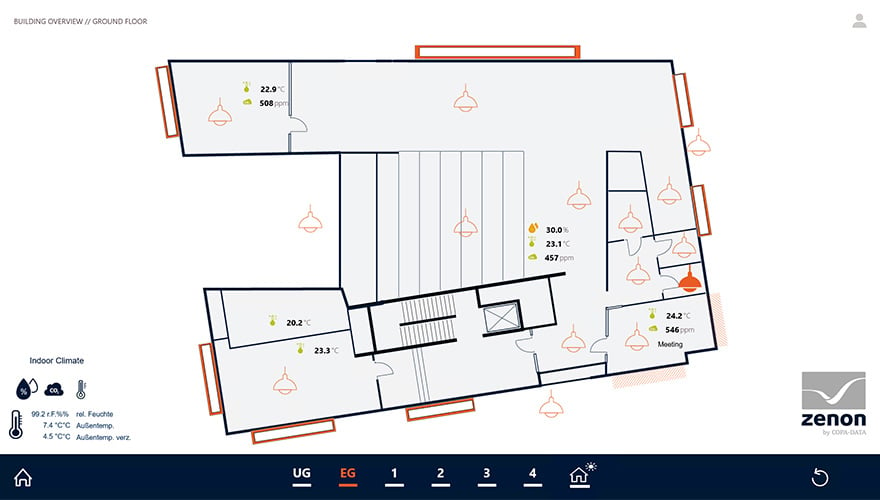 Building management at HQ 33 – clear visualization and intuitive control
This modular framework integrates self-consumption control, grid-support management, and comprehensive documentation and protocol functions into a single system tailored to user requirements. It enables targeted control of individual elements alongside monitoring, diagnostics, Peak Load Management, and communication to the higher-level control logic.
In practice: The central dashboard displays grid purchase, building consumption, solar production, and battery capacity. Detailed sub-views display heating and cooling status (geothermal brine-to-water heat pump), an overview of chargepoints and charging states, floor plans (shading status, lighting), and panoramic cameras.
A key feature of the HQ 33 project is the previously mentioned apprentice involvement: they share responsibility for developing, setting up, maintaining, and enhancing the overall system. “These diverse challenges require strong problem-solving skills,” emphasizes trainer Marko Šulejić. “With zenon, our project team has the ideal toolkit at its fingertips.” For example, servers must remain secure even during worst-case scenarios, such as a total failure of the building and energy management system. The flexible operation of wallboxes and fully automated shading also present new engineering challenges.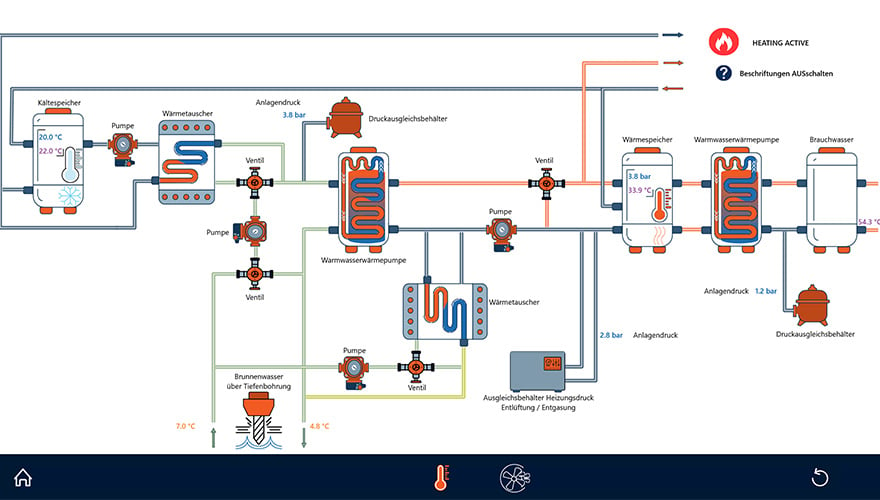 HVAC (Heating, Ventilation, Air Conditioning, Plumbing) – shown here is a schematic diagram of a heating and hot water system with heat pumpsn
When developing the BMS for HQ 33, the team leveraged experience gained from the existing HQ 7b facility. “That experience was especially valuable for refining user operation,” recalls Michael Legat, now Specialist Manufacturing Industry at COPA-DATA, who led initial software implementation as project manager. Originally, only the blinds and the lighting in HQ 7b were controlled via zenon. Additional components, notably the photovoltaic system, smart meters and charging stations, were added progressively over time.
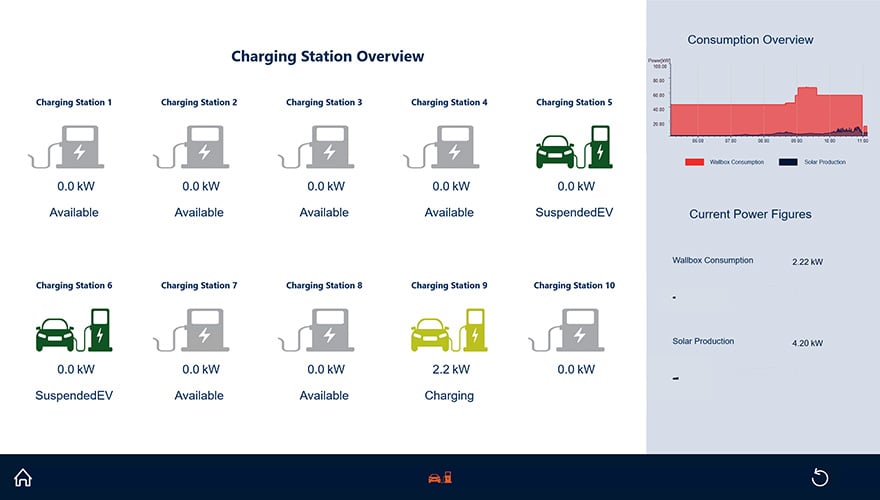 Wallboxes: Overview of the charging stations in the garage at Karolingerstraße 33
Learn more about sustainability at COPA-DATA.